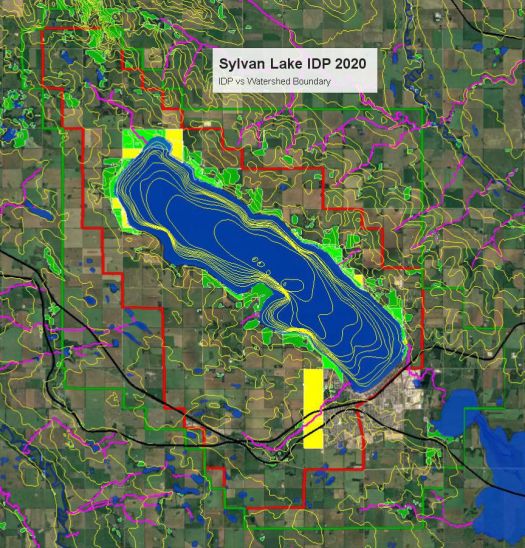
This set of graphics compiles data on the Environment, the Economy, and the Social cumulative effects categories within the boundary of the Sylvan Lake watershed.


Sylvan Lake Watershed Stewardship Society
Protecting the lake's natural assets and values through vigilance and science.
This set of graphics compiles data on the Environment, the Economy, and the Social cumulative effects categories within the boundary of the Sylvan Lake watershed.
